

Recently, I needed to write a check, and the only pen I could find was green. A green glitter pen, to be precise. I have middle school girls, so our household’s writing supplies lean more toward craft projects than banking.
Apparently, banks don’t accept checks in green glitter ink, but after learning that my choice of ink was a problem, I realized it had been a while since I’d examined how donors were paying for their gifts. Were checks continuing to lose ground? And if so, were existing donors changing their habits, or was something else driving the shift?
That sent me back to the data.
For years, we’ve watched checks and cash account for a declining share of nonprofit gifts. Our latest analysis shows that trend continuing.
Across 26 Masterworks clients, electronic payments accounted for an average of 52% of identifiable gift transactions in 2025, up from 46% in 2023.
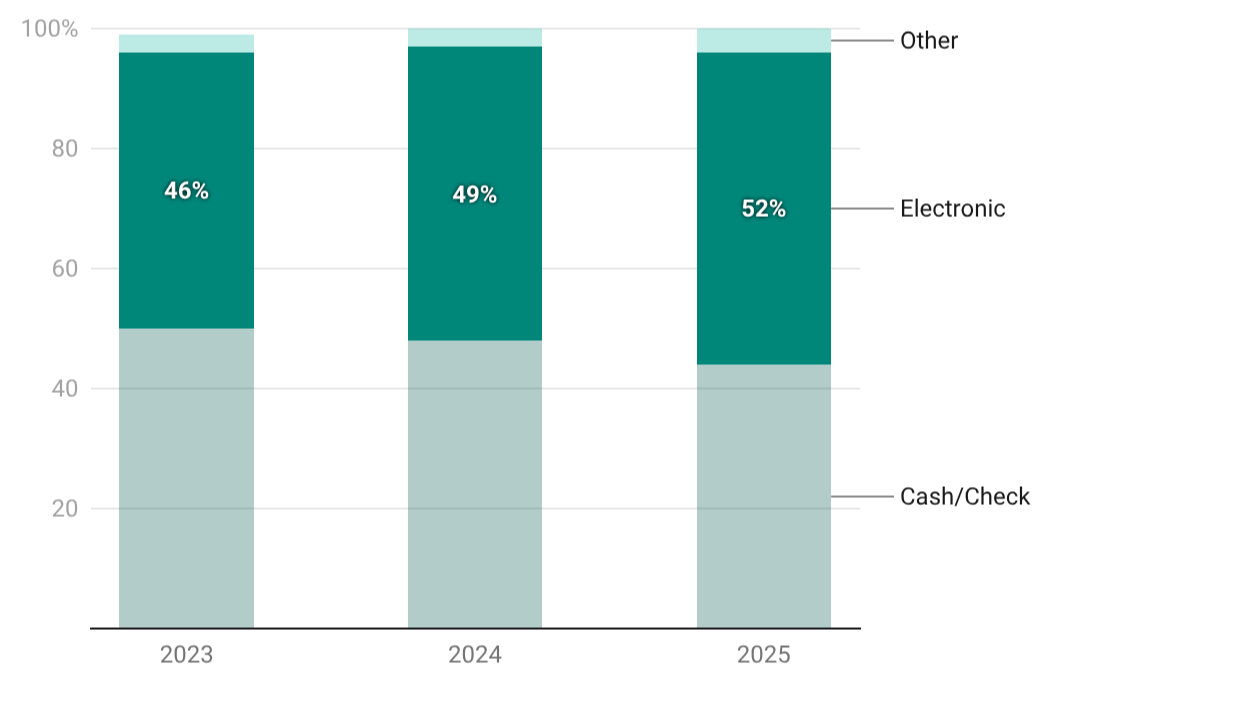
Each organization received equal weight in the average. When not weighted, electronic gifts accounted for 53% in 2025.
The shift was widespread: 24 of the 26 organizations saw an increase in their share of electronic payments.
But that raised another question: Are existing donors changing how they pay, or is the population of active donors changing?
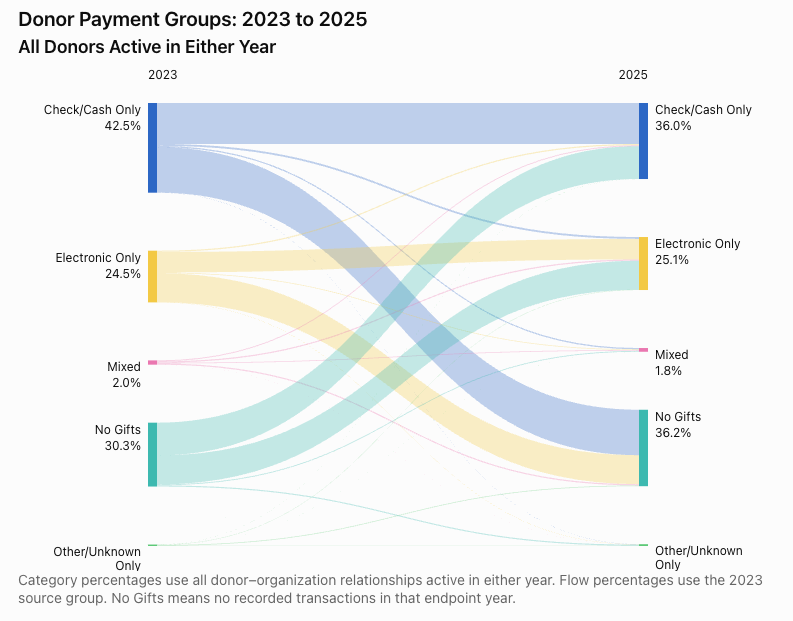
To investigate, we compared each donor’s payment methods in 2023 with those they used in 2025.
Most Continuing Donors Kept Their Payment Pattern
We grouped donors into three identifiable payment groups: check/cash only, electronic only, and mixed. Electronic includes cards, bank transfers, and digital wallets. Mixed means a donor used both check/cash and electronic payments during the year. Other payment methods (like stocks) were excluded from the analysis but accounted for approximately 3.5% of the transactions each year.
Among donors who gave in both years, payment patterns were remarkably stable.
Of those who gave exclusively through check/cash in 2023:
- 92.5% remained check/cash only in 2025.
- 4.3% gave electronically only.
- 2.9% used both payment types.
- 0.3% had only other or unclassified transactions.
In other words, 7.2% of continuing check/cash-only donors added or switched to electronic giving.
Movement also went the other way. Among continuing electronic-only donors, 5.5% gave exclusively through check/cash in 2025, while 3.2% used both.
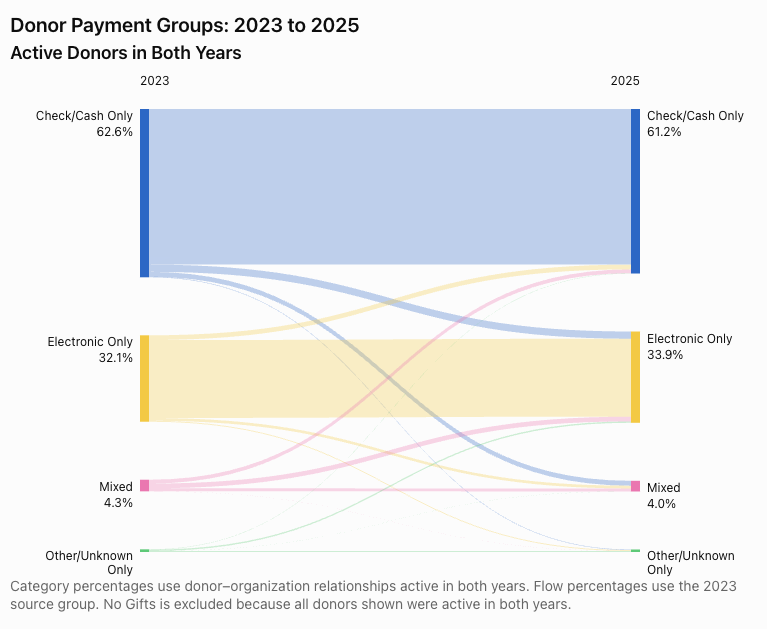
Even larger movements appeared when we included donors who gave in only one of the two years. That group includes newly acquired donors and donors returning after an inactive year. The changing payment mix therefore reflects more than existing donors switching methods.
Gift Counts and Donor Counts Tell Different Stories
Across the pooled sample, the share of active donors using electronic payments at least once rose from 38.0% in 2023 to 42.2% in 2025.
A monthly donor paying by card can generate 12 transactions in a year. Someone writing one annual check generates one.
Electronic payments can represent a majority of transactions while being used by a minority of active donor accounts. So looking at both the number of gifts and the number of donors gives clarity on what is happening.
Who Is Giving Also Matters
Payment preferences also differ between individual donors versus organizations.
Across the same 26 clients, an average of 78% of organizational donors used checks or cash in 2025, compared with 54% of individual and household donors. These figures include donors who also gave electronically during the year.
Organizations—including churches, businesses, foundations, and other groups—remained more reliant on traditional payments. But electronic usage increased in both populations. Among individuals and households, it rose from 44.6% in 2023 to 49.4% in 2025. Among organizations, it increased from 21.1% to 24.2%.
This adds another dimension to the payment story. A check-heavy donor file may reflect the types of donors supporting an organization, alongside their individual payment preferences. Before treating check usage as a sign that donors are resistant to change, it helps to understand who is writing those checks.
Make Giving Easier Without Losing Sight of What Motivates It
Clearly electronic payments are becoming more common, but the reasons behind that shift are more varied than a simple story of donors putting away their checkbooks.
Most continuing donors kept their payment pattern. Gift frequency affected the transaction mix. And organizational donors remained substantially more reliant on checks than individuals and households.
Those differences should inform how we serve donors.
Make electronic giving convenient, including on mobile devices. Continue providing an easy path for donors who prefer checks. Examine payment trends by donor type and recurring status before drawing conclusions about the entire file.
And keep digging into what prompted the gift. A donor can read a mailed appeal and complete their gift online. The payment is electronic, but mail may have influenced the decision. Our research on direct mail’s influence explores why that distinction matters.
In the end, our job is to make giving easier while continuing to invest in the relationships and communications that inspire it.
Methodology: Our analysis examined more than 7.6 million gift transactions across 26 nonprofit organizations. Payment shares average organization-level shares, excluding other and unclassified payments..